Developers » Data API » Rest API » Response structure & Parameters » “columns” parameter
“columns” parameter
Syntax
In the &columns= parameter, you can enter all dimensions and metrics that might be available in the call. To obtain the dimensions and metrics labels, you need to create the template containing the information which you require in Data Query and check the API URL that is dynamically populated:
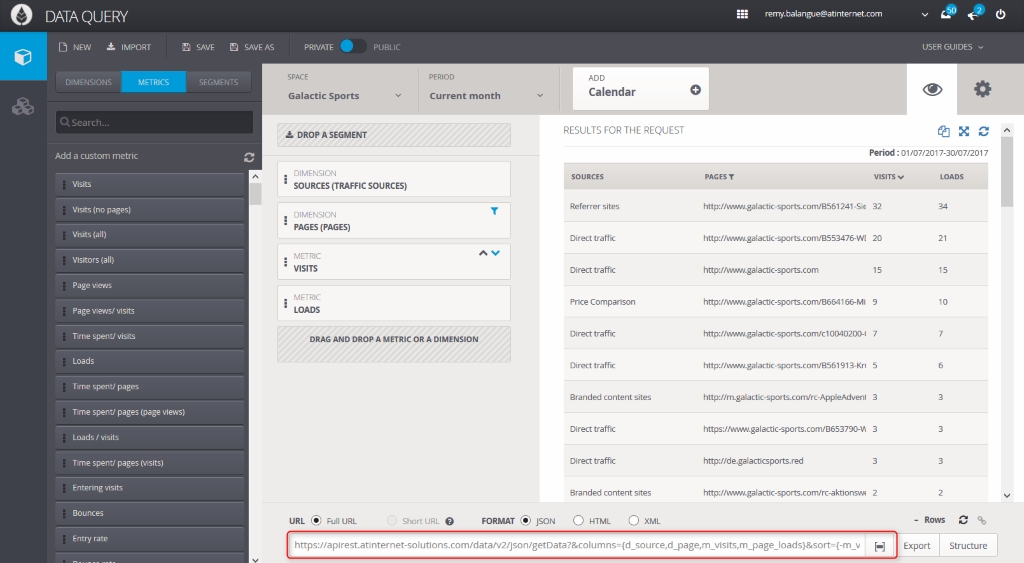
Each dimension requested in the Rest call is entered according to the format d_xxxxx (where xxxxx is the dimension’s character string).
Each metric requested in the Rest call is entered according to the format m_xxxxx (where xxxxx is the metric’s character string).
All of the dimensions and metrics are separated with a comma.
Example:
&columns={d_page,d_source,m_visits,m_bounces}
Notes:
- It is obligatory to enter a metric in the call.
- The order of the request is the same as that of the response.
- No item may be requested 2 times for the same period.
- It is possible to call up to 30 items (dimensions/metrics) in one request.
Metadata
The columns parameter allows you to describe overall information oriented toward the role of each attribute (column) contained in your API call.
XML example:
<Columns>
  <Column Name="d_referrer_url" Label="urls" Category="Dimension" Type="String" CustomerType="URL"/>
  <Column Name="m_bounce_rate" Label="Bounce rate" Category="Metric" Type="Decimal" CustomerType="Percent" Precision="3" Summable="True"/>
</Columns>
Explanation of the parameters:
- Name: corresponds to the technical name of the column (starts with: d_ for a dimension, m_ for a metric).
- Label: Name shown in the column title, depending on the language
- Category, with the values:
- Dimension
- Metric
- Type, with the values:
- Date: ISO date output format
- Integer: whole number output format
- Decimal: decimal output format with 10 figures max after the comma
- String: character string output format
- Boolean: True or False (0/1)
- CustomerType: information relative to the possibilities of formatting data with the values: date, time, datetime, integer, decimal, string, boolean, percent, duration, ID, currency, GeoID, GeoCode, year, semester, quarter, month, week, weekday, hour, minute, URL, email.
Note: These explanations of data types are strictly informative; all data sent back by the API is not formatted. - Precision: metadata dedicated to decimal, percent and currency types which tell you how many digits were retained after the comma.
In the case of %, precision applies to data in decimal format.
Precision=”3″ for 18.345% signifies that we only retain 18.3% (so, 0.183) - Summable: tells you if the metric is summable or not. This only applies to metric-type attributes. This information can also tell you if the sum of values is 100% in order to have a pie chart-type representation. This information varies based on the context of the call, and it is only possible to sum the items that are unique during the visit.
All this information is not obligatory; information is only given according to the context of the API call.
Comparison of metrics across several dates (variations and differences)
When columns contains the same metric across several periods, it is possible to directly obtain, in the form of a calculated metric, the variation or the difference between 2 periods.
You must use the functions var:{} or dif:{} and specify the metric and periods in question.
Example:
columns={d_page,p1.m_visits,p2.m_visits,var:{m_visits,p1,p2},dif:{m_visits,p1,p2}}
dif:{metric, p1, p2} means metric(p2) metric(p1) (difference of a metric between 2 periods)
var:{metric, p1, p2} means (metric(p2) metric(p1)) / metric(p1) (variation of a metric between 2 periods)
Examples:
if p1.m=50 and p2.m=100 – var:{m,p1,p2} gives 1 (in other words, 100% increase)
if p1.m=100 and p2.m=50 – var:{m,p1,p2} gives -0.5 (in other words, 50% decrease)
if p1.m=100 and p2.m=0 – var:{m,p1,p2} gives -1 (in other words, 100% decrease)
if p1.m=0 and p2.m=10 – var:{m,p1,p2} is infinite (it returns NaN (Not a Number))
Ratio
When you request a total or reference row to have the overall value of requested metrics, it is possible to have a ratio-type metric: the ratio between each metric value (row by row) and the total value or reference.
You must use ratio:{} in the columns parameter according to the nomenclature:
ratio:{metric_name,total_name}
Example:
https://apirest.atinternet-solutions.com/data/v2/json/getData?&space={s:#YourSiteID#}&columns={d_country, m_visits, ratio:{m_visits,total:all}, m_page_views}&include={total:all}&sort={-m_visits}
Take a look at the total parameter.
Hidden columns
There are two ways to hide a column:
- By putting a filter on a dimension, without entering the dimension within the columns parameter.
- By adding a hidden:1 property for the dimension to be hidden: no grouping action on the other columns dimensions makes duplicates possible.
Example:
| Country | Sources | Number of visits |
|---|---|---|
| France | Search engine | 50 |
| France | Direct | 40 |
| South Africa | Search engine | 30 |
| South Africa | Links | 20 |
| France | Links | 10 |
| South Africa | Direct | 10 |
I wish to filter for FRANCE and then group the remaining dimension Sources. So I do not request Country in the columns parameter: columns={d_source,m_visits}&filter={d_geo_country:{$eq:’france’}}
| Sources | Number of visits |
|---|---|
| Search engine | 80 |
| Direct | 50 |
| Links | 30 |
I wish to filter for France and get all results, while hiding the Country column: columns={d_source,d_geo_country:{hidden:1},m_visits}&filter={d_geo_country:{$eq:’france’}}
| Sources | Number of visits |
|---|---|
| Search engine | 50 |
| Direct | 40 |
| Search engine | 30 |
| Links | 20 |
| Links | 10 |
| Direct | 10 |